Income Insurance
Income Insurance
Client
Year
URLs
Transforming Complex Insurance Information Into Clear, Human-Centred Infographics for 2M+ Policyholders
At Convertium, I worked with Income Insurance to redesign product explainers that were text-heavy and difficult for everyday consumers to understand. I created a system of 10+ narrative infographics that simplified complex topics—such as retirement planning and coverage benefits—into visuals that could be understood at a glance.
These designs improved clarity and engagement, contributing to an estimated 20% lift in user interaction (session duration and click-through). I also developed a reusable layout and illustration system that enabled internal teams to scale future campaigns without starting from scratch.
The result: clearer communication for 2M+ policyholders, better financial literacy, and less friction during onboarding and decision-making journeys.
Client
Income
Year
2021-2024
URLs
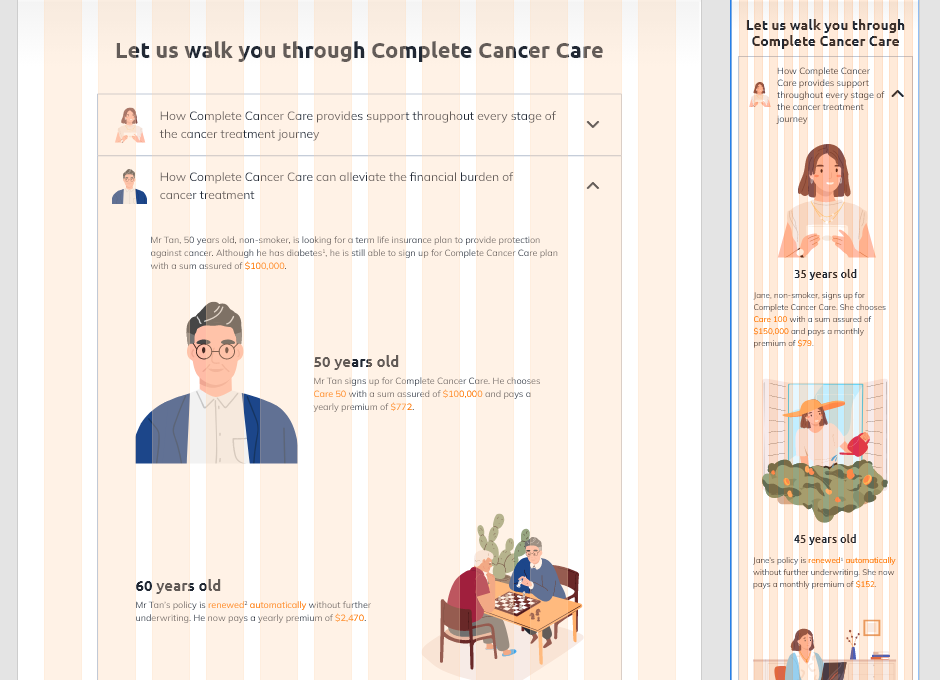
Invest flex
Complete Cancer Care
P.A. Fitness
-
Income’s product pages relied heavily on dense, technical text, making key financial concepts difficult for users to quickly understand. As someone who has had to navigate medical and insurance information myself, this problem hit close to home — when you’re facing a very real human concern, the last thing you want is another intimidating wall of text.
-
Conceptualised and illustrated a suite of infographics and visual explainers that translated financial and insurance data into clear, narrative-driven designs aligned with Income’s brand.
-
A library of 10+ illustrated infographics used across digital product pages and campaigns, improving clarity, supporting future scalability, and increasing engagement by an estimated 20%.


The concept aimed to transform abstract insurance policies into visual stories about care, trust, and preparedness.
I explored soft, friendly character designs and simplified shapes to evoke a sense of reassurance without oversimplifying the message. The palette drew from Income’s corporate orange but introduced warmer neutrals and gradients to improve legibility and visual comfort.

Turning Financial Anxiety Into Visual Clarity
The visual language leaned on metaphors — jars growing plants for compound wealth, umbrellas for protection, ladders and milestones for retirement growth — to help users understand the function of each plan immediately before reading a single line of text.
Built on a Flexible 12-Column Responsive System
To ensure complex financial information remained digestible across screens, the Income visuals were built on a responsive 12-column grid. On desktop, the grid provided structure and hierarchy for icons, data points, and illustration-led storytelling. On mobile, the grid collapsed into proportional columns that preserved reading flow and visual balance without simply compressing content.
This system allowed each infographic to scale cleanly while maintaining clarity, brand consistency, and accessibility standards — critical when communicating retirement, insurance, and savings plans.
A fully illustrated narrative journey
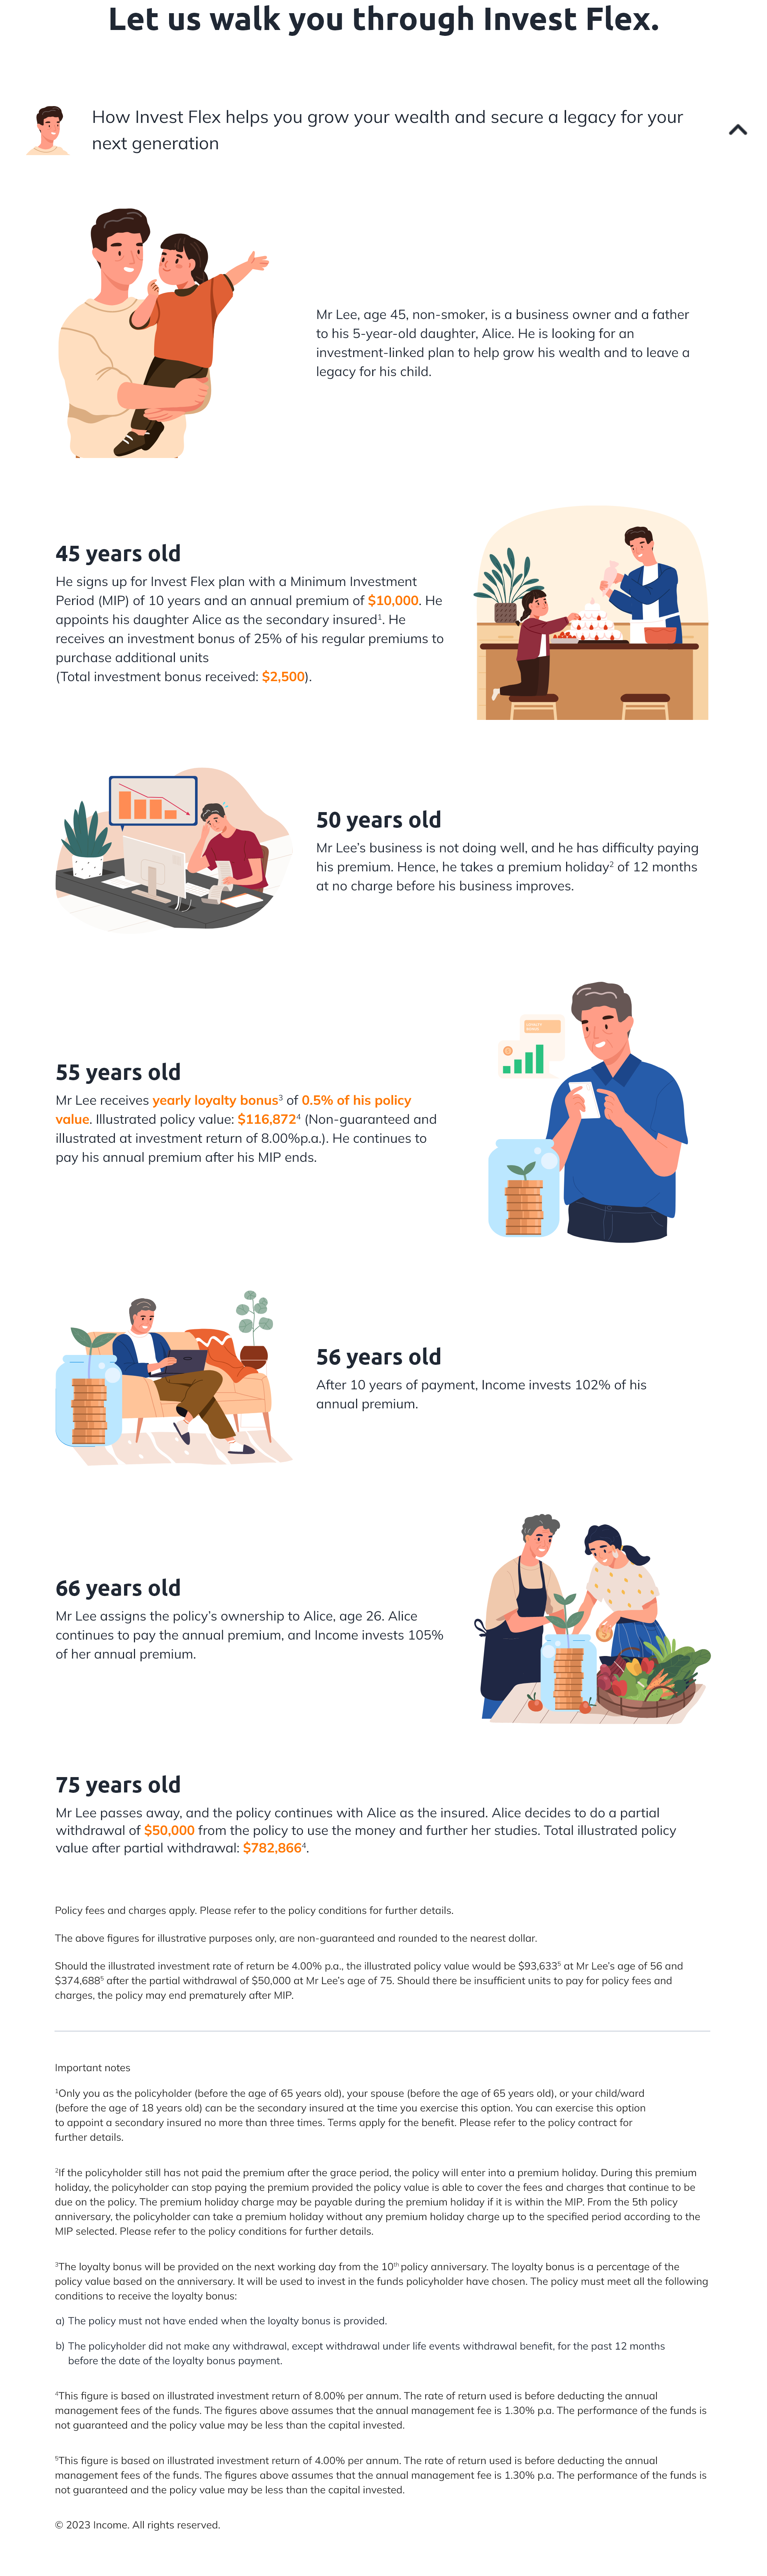
Visual storytelling was used to make a 30-year financial plan feel approachable, intuitive, and emotionally relatable for users outside the finance world.

Introduction: Mr Lee & Alice
Human before numbers
We start with characters, not charts — connecting users emotionally and grounding the financial story in real life motivations (legacy, family, security).
Age 45: First Investment
Visual metaphor: “building together”
The cake decorating scene reinforces the idea of early financial investment as a family effort, growing over time.
Clear values + visuals = faster message retention.
Age 50: Business downturn
Moment of hardship rendered with empathy
Instead of just saying “premium holiday,” we show stress, paperwork, and real-world uncertainty — making complicated clauses human and understandable.
Age 55: Growth returns
Chart + growing plant jar = dual reinforcement
The plant grows to signal compounding returns, while the chart on the phone reflects realistic performance tracking — blending metaphor and real-world UX.
Age 56: Continued investment
Minimalist reinforcement panel
A quieter scene shows stability and growth after adversity. The theme: “Long-term investment pays off.”
Planned legacy → new generation
Alice joins the frame completely — visually communicating succession of ownership without reading a single sentence.
Jar is bigger, harvest appears — wealth is now also producing outcomes.
Age 66: Policy transfer


Design that makes complicated insurance information feel simple and human.
The redesigned visuals saw a 20% increase in click-through rates and 2× longer dwell times on insurance education pages. The success of this visual system led to its adoption in ongoing campaigns, setting a new benchmark for how the brand communicates complex information.